Enjoyed this post?
Be sure to subscribe to the nopAccelerate newsletter and get regular updates about awesome posts just like this one and more!







Your store generates data every day.
Orders come in, customers register, products sell, discounts are applied, returns are processed, and sales move up or down. Over time, this creates a lot of information about how your store is performing.
The challenge isn’t always getting the data.
The real challenge is understanding what the data is telling you and what you should do next.
A revenue number can tell you how much you sold. A product report can show what sold the most. A customer report can show who is buying. Put these numbers together, and they can help you understand where your store stands, what needs attention, and where your next sales or marketing effort should focus.
That’s where useful eCommerce analytics starts.
Most eCommerce stores have more information than an owner or admin can reasonably review every day.
You may have data around:
The information is useful. But seeing a number is only the first step.
Suppose your store generated $50,000 in revenue last month.
Is that good?
You need more context to answer that.
Did orders increase? Did average order value change? Which products contributed most? Did discounts play a major role? Are returning customers buying more? Did returns also increase?
The number tells you what happened. The questions around it help you understand what deserves attention.
Good reporting gives you a practical view of store performance without making you search through every order or product record.
The exact metrics depend on your business, but a useful store review usually starts with a few key areas.
Revenue, order volume and average order value give you a basic picture of sales performance.
Looking at them together is more useful than looking at revenue alone.
If revenue increased while order volume stayed almost the same, customers may be spending more per order. If orders increased but average order value dropped, you may be gaining more transactions without increasing the value of each purchase.
The point is not to treat one number as an answer. Use the numbers together to find the next question.
Customer data can show whether your store is attracting new buyers and whether existing customers are returning.
Useful numbers can include:
A store with strong sales but weak returning-customer activity may need a different focus from one where repeat purchases are growing.
Product data can help answer:
This can influence what you feature, promote, bundle, stock or investigate next.
Sales are only one part of running an online store.
Pending orders, returns, payment methods and shipping methods can reveal operational issues that may affect customers or your team’s workload.
A useful reporting setup should help you see these signals alongside sales performance.
A report becomes more useful when you stop looking at numbers in isolation.
Imagine your revenue is up 15%.
That sounds positive.
But ask:
Now consider the opposite.
Orders are up, but average order value is down.
That doesn’t automatically mean something is wrong. It gives you something worth investigating. Perhaps a promotion is bringing in smaller orders, a particular category is driving the increase, or customers are responding well to lower-priced products.
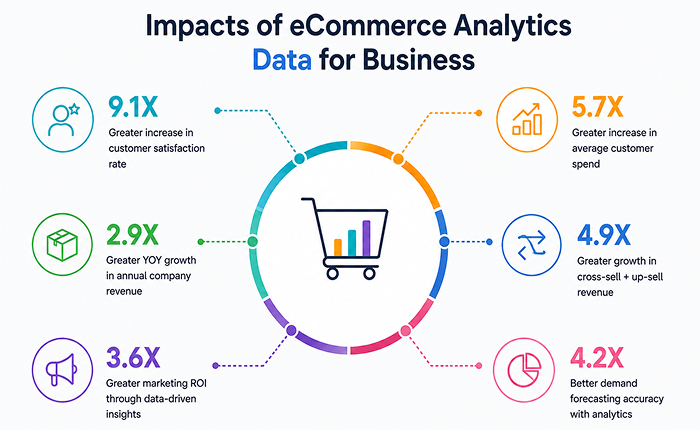
Gartner projected that by 2026, 65% of B2B sales organizations would move toward data-driven decision-making. Yet only 29% of organizations can evaluate data fast enough to stay ahead.
The important point is:
A number gives you a signal. Context helps you understand the signal.
Useful eCommerce analytics goes beyond collecting KPIs. It connects those numbers to questions and decisions.
Instead of starting every review with, “What reports do I have?”, start with:
That small change can make reporting much more useful.
Look at revenue, orders, average order value, products and categories.
You may discover that a small number of products are responsible for a large share of sales. That could influence what you feature or promote next.
Look at product revenue, quantity sold, category performance and changes over time.
A product that performs well may deserve more visibility. A product that consistently underperforms may need a closer look at pricing, positioning, availability or demand.
Compare new and returning customers and review customer activity over time.
If returning customer activity is improving, understand what may be helping. If it is declining, that could be a reason to review retention or customer engagement.
Look at return activity over time and identify whether particular products or periods stand out.
A rising return trend doesn’t tell you the cause by itself, but it tells you where to investigate.
Sometimes the answer doesn’t come from one report.
You may need to compare sales, customers, products and operational data before you see the bigger picture.
That’s when reporting starts becoming a decision-making tool rather than just a record of what happened.
The real value of store data comes when you use it to plan what happens next.
If a category consistently generates strong sales, that could support a decision to give it more visibility, create related bundles or promote complementary products.
If a product gets attention but generates weak sales, you may want to investigate pricing, product information, availability or the customer journey before putting more marketing behind it.
Customer data can support another decision.
If returning customers are becoming a larger part of sales, that may influence how you approach retention, repeat purchases and customer communication.
Operational data matters too. If pending orders or returns are increasing, your next priority may not be another promotion. It may be fixing the operational issue first.
This is why reporting shouldn’t become a weekly exercise where someone exports numbers, puts them into a spreadsheet and moves on.
Ask:
“What changed, why might it have changed, and what should I investigate next?”
Predefined reports are useful because they give you a quick way to review common information.
The problem starts when your question doesn’t fit neatly into one of those reports.
You may suddenly want to know:
Which products generated the most revenue last month?
Or:
Are returns increasing?
Or:
Which category contributed most to sales?
Or:
How are returning customers performing compared with new customers?
These are normal business questions. But answering them may require moving between screens, changing filters, exporting information or asking someone with technical knowledge to help.
That creates friction.
When getting an answer takes too much effort, useful questions often remain unanswered.
AI doesn’t need to replace your reports to be useful.
It can make it easier to explore your store data when you have a specific question.
Instead of remembering which report contains the information you need, you can ask the question directly.
For example:
“Which products had the highest revenue last month?”
A conversational analytics workflow can clarify important details when needed, run a safe read-only query against the relevant store data, and return a clear explanation with key numbers and, where useful, a chart.
The workflow changes from:
Find the right report → Apply filters → Review the results
to:
Ask the question → Get the relevant result → Understand it → Decide what to investigate next
The goal isn’t to make analytics more complicated with AI. It’s to make the information you already have easier to access and understand.
For a nopCommerce store, a useful analytics setup should make everyday store review easier.
It should help you:
The benefit isn’t having the largest number of reports.
It’s being able to get the information you need without creating unnecessary work.
Analytics should help your team run the store, not create another problem to manage.
For an admin-focused analytics solution, a few things matter.
Store analytics can stay within the administration side of nopCommerce rather than adding unnecessary customer-facing functionality.
If the purpose is to understand store data, the analytics layer should not need to change checkout or order data simply to provide a report or answer a question.
Reporting needs to remain practical as store data grows. Date-range controls, query limits, caching and timeouts can help keep analytics responsive.
You don’t need to review every available metric every time.
A simple routine can start with five steps.
Review revenue, orders and average order value.
Ask:
Are sales moving in the direction I expect?
Look at new and returning customers and available retention indicators.
Ask:
Are we building repeat business or relying mainly on new customers?
Review top products and categories.
Ask:
What is selling, and what deserves more attention?
Review pending orders, returns and other relevant operational data.
Ask:
Is anything happening that could affect customers or the team’s workload?
Once you’ve reviewed the basics, ask:
“What changed, and what should I investigate next?”
That’s often where reporting becomes more valuable.
Your store already generates a large amount of useful data.
The advantage doesn’t come from collecting more numbers. It comes from making important information easy to review, putting it into context and using it to guide the next decision.
Reports show what happened.
Good analysis helps you understand what deserves attention.
And when you can ask specific questions about your store data without hunting through reports, you can move from simply checking performance to acting on it.
For nopCommerce store admins, an admin-only, read-only analytics solution with dashboards, reports, exports, and plain-English data questions provides a clearer view of store performance. Quickly find the information you need to make better sales, marketing, and operational decisions.









Leave A Comment